With the launch of Google Analytics 4 (GA4) in October 2020, a lot has changed. Not only is the user interface new but also the underlying data model and ways of tracking Google victims.
Google Analytics 4 is more than just an upgrade.
It is a new generation of Google Analytics.
Switching from Universal Analytics to Google Analytics 4 is similar changing from a hammer to a spanner, because actually EVERYTHING IS DIFFERENT.
What is different between the two and how UA works compared to GA4 will be explored here. I’ll start from the “bottom up” – from the lowest level, the data collection (tracking), to the top level, the user interface.
Table of Contents
Google Analytics 4 – why 4?
Before we get straight into the tool comparison, you may be asking yourself: Why Google Analytics 4? What is the 4 all about?
It all started with Universal Analytics back in 2015: Google gave its Analytics the new name “Universal” to differentiate it from the previous version, the “Classic” Analytics.
The name fit, because with Universal Analytics (UA) you could suddenly track ALL possible data in Google Analytics through the Googleverse: No longer just website data but also offline and offsite data. Google Analytics had thus become the universal, enterprise-wide data collector.
But you can’t get more universal than universal, and so Google had to come up with a new name for the current version of Google Analytics – which was originally App+Web Property.
App+Web Property, sounds like tech-boring jargon that few can relate to.
Then Google considered GA2.
But Google HQ didn’t like it.
In their eyes, the new GA was not an evolution of UA. Not only was the user interface different but also the underlying data model and tracking had completely changed.
So Google has opted for “Google Analytics 4 or GA4”.
Why 4?
Because it is actually already the fourth version of Google Analytics:
Google Analytics V1: Urchin
Google Analytics V2: Classic Analytics
Google Analytics V3: Universal Analytics (or GA3)
Google Analytics V4: App+Web resp. GA4
Its a bit like the mentality with the Mac OS. They keep needing to reinvent themselves and so change their OS names from animals to USA landmarks. Who knows, maybe next it will be Steve Jobs’s favourite food.
A quick warning, If you search the big WWW for information about Google Analytics, always pay attention to which version it is: Universal Analytics (=old) or Google Analytics 4 (=new).
So we are now in the age of Google Analytics 4.
Let’s now take a detailed look at the differences between Google Analytics 4 vs Universal Analytics:
Everything is New: Starting with tracking in Google Analytics 4
Compared to Universal Analytics, Google Analytics 4 changes quite a bit in tracking.
What do we mean by tracking. Basically following the breadcrumbs left by visitors on your website and app.
Let’s dive in
Analytics.js vs gtag.js
With each new version of Google Analytics, the underlying tracking script has also changed:
GA V1 Urchin: urchin.js
GA V2 Classic Analytics: ga.js
GA V3 Universal Analytics (or GA3): analytics.js
GA V4 App+Web or GA4: gtag.js
Note: A tag is like a connection between your website and Google.
We are now in the age of gtag.js, as Google Analytics 4 is implemented on the website via the gtag.
Gtag is the programming slang abbreviation for Global Site Tag.
Unlike analytics.js, gtag is no longer a pure Google Analytics library, but a whole tagging framework that has an API to send data to the following Google products:
- Google Analytics 4
- Google Ads
- Campaign Manager
- Display & Video 360
- Search Ads 360
Gtag replaces the Google Ads Conversion Tracking (conversion.js) and supports and specifies the Floodlight Tracking.
With this, Google focuses on the technical unification of all its Google products.
But I know what you want to know. Whats the advantage of the new tag.
There are quite a few:
- It is easier to install the tracking code for ALL Google products. Before it was a nightmare
- Even more precise conversion tracking.
- Less technical errors (Thank God)
Hits vs. events: The new data model
Probably the most important, groundbreaking and biggest change in Google Analytics 4 is the data model.
Instead of hits, Google Analytics 4 focuses on events.
At first glance, this doesn’t sound all that spectacular, but it means that there are NO longer pageviews in the conventional, technical sense in GA4.
Sure there are pageviews but they are tracked as events in GA4.
Reminder – Universal Analytics distinguishes between 6 hit types:
- Page hits
- Event hits
- Ecommerce hits
- Social interaction hits
- User Timings
- Exceptions
In Google Analytics 4, each hit is technically just an event. This applies to:
- Page views
- Transactions / Ecommerce Hits
- Social Interactions
- User timings
Just to keep it simple: ALL interactions in Google Analytics 4 are considered events.
However, events in Google Analytics 4 are not the same events as in Universal Analytics: Instead of the previous event parameters “Category, Action and Label”, there is only the event name in GA4.
I will let you decide if you think Google is dumbing down a great tool or simplifying things for the better
In addition to the event name, GA4 allows you to record up to 25 additional parameters per event. You are free to choose what you want and are no longer limited to “Category, Action and Label”. This was tied to Google tag manager and was in my opinion very limiting.
On a sad note: Migrating from UA to GA4 is taxing because all tracking has to be mapped to the new event-based data model. 🤯
Once the switch is made, however, you’ll find that the event-based data model makes a thousand times more sense. It is more logical, more flexible, and simpler.
You’ll love it🧡.
However, in Google Analytics 4, you can only collect a total of 50 Custom Text and 50 Custom Numeric parameters per Property.
An Important thing to note: The difference from Universal Analytics is that in Google Analytics 4 you have to register your event parameters in the UI. Without registration, you will have no event parameters in Google Analytics 4.
AGAN, the migration is a headache.
One final advantage of GA4 is that some events are automatically recorded for you
Standard Events in GA4
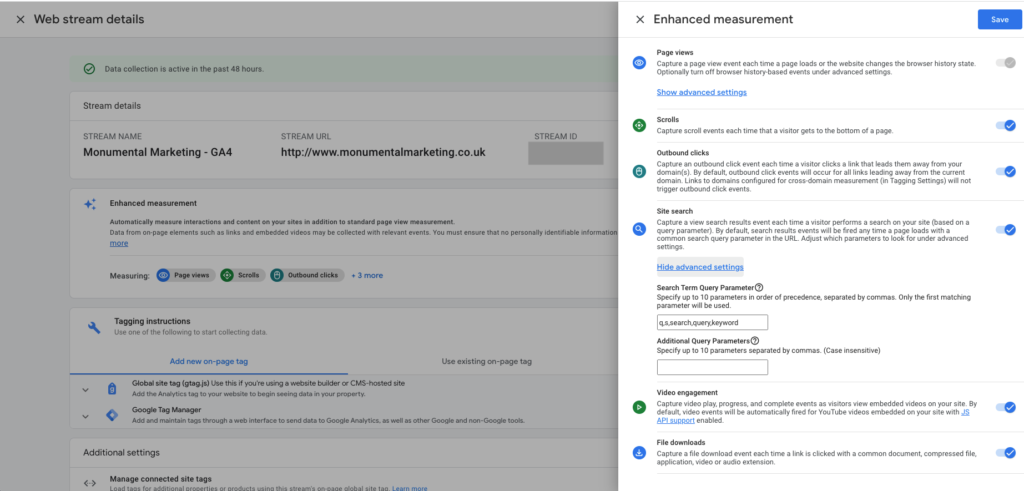
With the implementation of the GA4 tracking code (gtag) on your website, the following events (if enabled in the datastream) will be captured completely automatically:
- Pageview
- Scrolltracking (as in how far down a webpage a user goes)
- Outbound Clicks (Clicks to other websites)
- Site Search
- Video Engagement (If they pay a video and for how long they watch)
- File Downloads
Note: Google calls these events Enhanced Measurements. Just another term for saying more advanced data that you can use to better engage your visitors.
It is important that you know how Google collects the automatic events: For example, internal search tracking only works automatically if you have q, s, search, query or keyword in the URL.
If you use another query parameter, you have to set it in the data stream settings first.
To do this click in the GA4 Admin Interface (wheel on the bottom left) on Property Level -> Datastreams -> Select Webstream on the small gear in the field “Optimized Analyses”. You will get to the following settings page and can set your parameter here:
According to the description, we can only guess how the automatic scroll tracking works: Every time a user reaches the end of the page, a scroll event is recorded. 🤷🤔
But again, what Google writes vs what they mean are two different things.
If a user scrolls 90% on the website, it captures that they scrolled 90%. However, it does NOT record if 10%, 25% or 50% was scrolled.
Unfortunately, this is the default setting and cannot be adjusted.
In addition to the optimized analytics (or enhanced measurements), there are other automatically captured events for your website:
- first_visit: A user visits the website for the first time.
- session_start: For how long the visitos was on the page/site
- page_view: Page view
- user_engagement
GA4 also captures:
- Language
- Location
- Referrer
- Page title
- Screen resolution
And then there are event recommendations: Google has defined events with associated parameters for various industries and highly recommends using them because they (supposedly) give you accurate reports.
Which industries are there event recommendations you ask? These are:
- Retail / Ecommerce
- Career and profession, education, local offers, real estate
- Travel (hotel, flight)
- Games
My take: I think the event recommendations are especially cool because they help customize Google Analytics for you.
Many websites and companies had a basic-only setup in Universal Analytics. With the event recommendations in GA4, you move towards an individual setup.
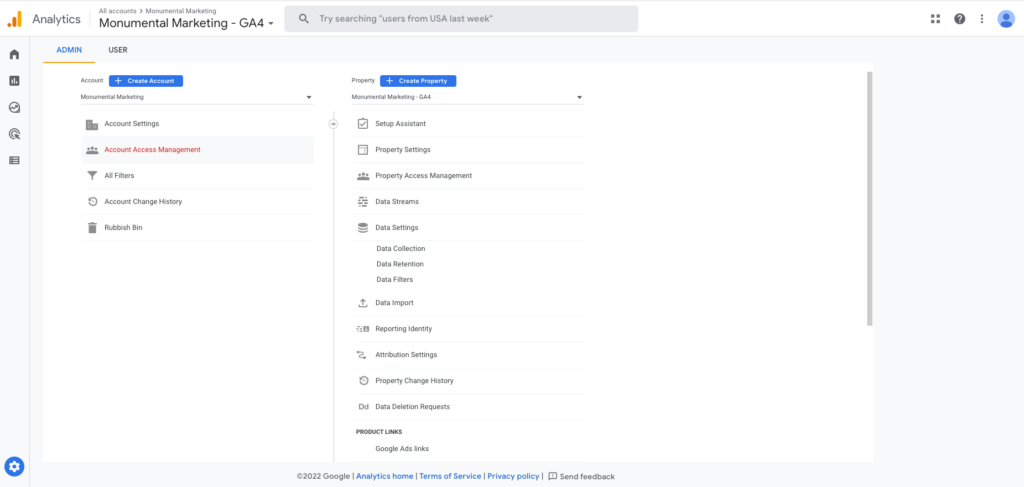
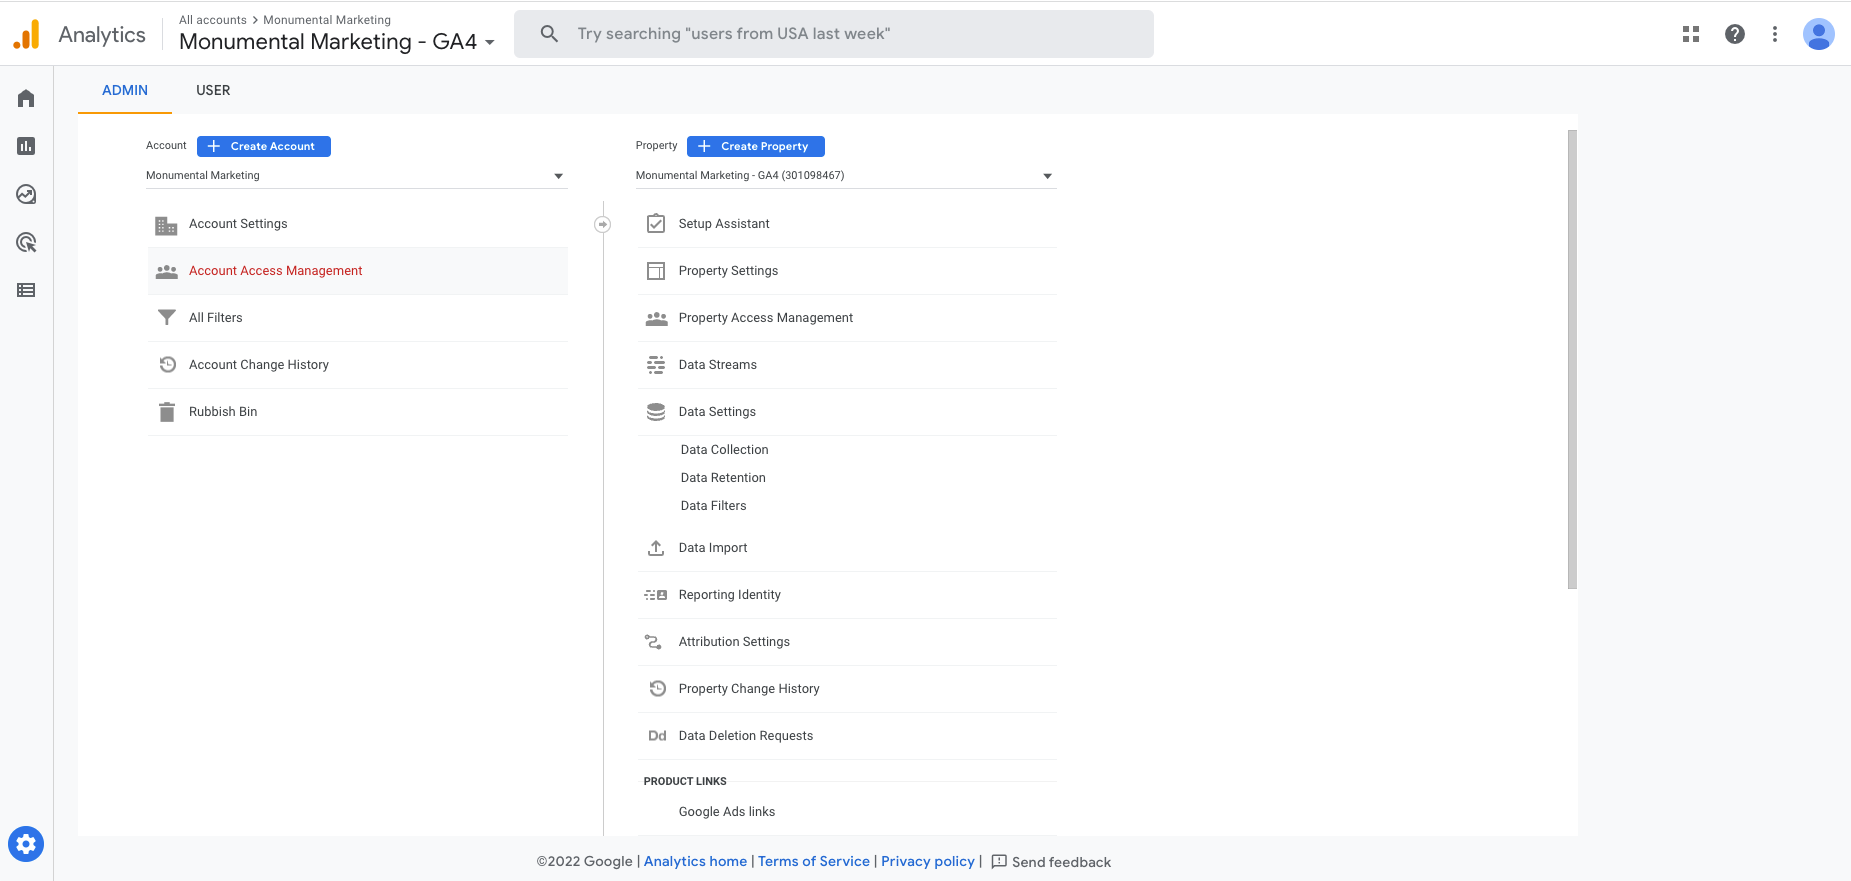
UA vs. GA4: How the administration area differs
The settings in the administration area of Google Analytics 4 have also changed significantly compared to Universal Analytics.
In particular, I find it confusing at first that some settings are made in the admin interface and some are made directly in the reports.
Let’s look at the differences in detail:
Help my data view is gone😱: Data View vs Nothing
You’ve probably noticed that Google Analytics 4 Properties no longer have any data views:
Don’t worry, you haven’t forgotten any settings: In Google Analytics 4, vs Universal Analytics there are simply no more data views.
In GA4 you can’t create your desired data graphs or tables – at least not as easily as in UA.
Data views were used to pre-filter data and to avoid constant filtering and/or segmenting. So often countries or store data views were created e.g. for DE, AT and CH, if one was active in these countries. Data views were also created for subdomains e.g. blog, store, etc.
With data views you could also bypass the rudimentary user management from GA: Namely, if users get minimal access rights (read and analyze) they can view ALL data – in Universal Analytics on view level, in GA4 on property level.
Thus, in Universal Analytics, custom data views were created and e.g. transactional data was excluded. These data views were then shared with those users who did not have permission to see sales figures.
Some more bad news: Backup data views can no longer be created in GA4 either.
Here’s a useful tip If you are in a Google Analytics property and you are not sure if you are working with the old version of GA (Universal Analytics) or with the new one (Google Analytics 4), first of all go to the admin interface and check if there is a data view:
- If there is a data view, you are in a UA Property.
- If there is no data view, you are in a GA4 property.
Alternatively, you only create properties in Google Analytics 4:
The property is your data pot: this is where your data is stored.
To capture only the data you want, you have the option to set filters:
Data Filter vs Property Filter
The data filters are a brand new setting, which did not exist in the App+Web Property (the previous version of Google Analytics 4). I’m all the more pleased to see that they are now available in Google Analytics 4 – unfortunately, only in a very limited way at the moment.
So currently there are only two filter types on property level:
- Include / Exclude Internal Traffic
- Include / exclude developer traffic
Note: With these filter types you can exclude internal traffic and test system traffic from GA4. So basically, if any member of your company is going through the site or you are testing something then this will not be recorded. Only outside visitors will be shown. You will be like Frodo Baggins with the one ring on.
Tip💡: You can also create a separate Google Analytics 4 property for your internal traffic and test system traffic.
Another excitingly feature that Google Analytics 4 introduced were the so-called filter modes. A filter can have one of three statuses:
- Testing
- Active
- Inactive
In testing mode, Google Analytics applies the filter for testing purposes only. No permanent changes are made.
This is super handy because in Universal Analytics you had to create a separate data view to be able to test filters – at least that’s what I always did and saved my main data view’s data that way a few times. 🦸♀️
Filter testing was generally very laborious and tedious in Universal Analytics.
With the new test mode in Google Analytics 4, this is now simplified.
The filter is activated when the active mode is enabled.
To deactivate the filter, the mode is set to inactive.
Another bonus with GA4 is that spam traffic is automatically excluded in Google Analytics 4.
NEW: Data Streams
Another new feature in Google Analytics 4 are data streams.
A data stream is basically a data source. Only when a data stream is set up in a GA4 property, will data flow into your GA4 property.
So basically you decide where information for your Google Analytics account will come from.
Please note that you also need to implement the tracking code on your website. So you need two things for data to flow into your GA4 property:
1) A data stream
2) The tracking code installed in your website.
In comparison, in Universal Analytics, it was enough to just implement the tracking code on the website. There was no need to set up an extra data stream.
But that was simply because in Universal Analytics there was ONLY one data source: the website.
In Google Analytics 4, there is an option to connect three data sources:
- The website.
- The iOS app.
- The Android app.
And not just 2 apps (IOS and Android). Up to 4 apps can be analyzed in addition to your website.
The big advantage: with this is that apps and web data can now be analyzed together – in the same data pot.
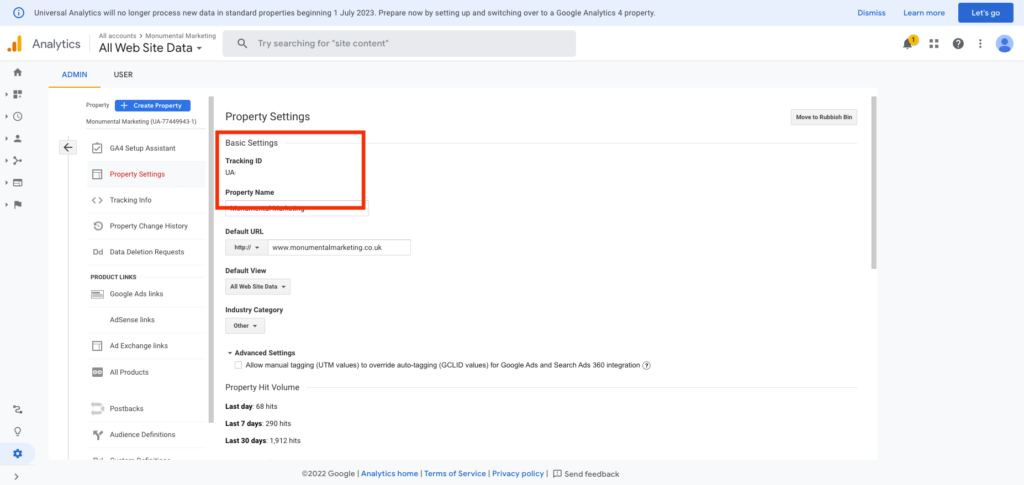
UA-ID vs G-ID
Google is parting ways with the well-known Universal Analytics Tracking ID – the UA-ID such as UA-12323223-1:
Instead, Google Analytics 4 introduced the G-ID. Sounds gangster doesn’t it?]
The G-ID is a random measurement ID and a combination of numbers and letters beginning with G- such as G-TQY59CX7WV:
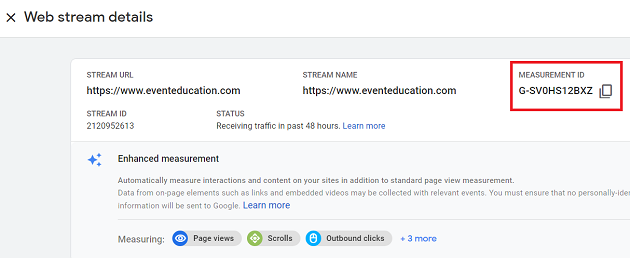
Info: With this Google gets the spam problem (finally) under control, because the G-ID is not as easy to assign to the account as the UA-ID.
By the way, you can find the new G-ID here: Administration -> Property Level -> Datastreams -> Web Datastream.
Click on a web datastream and you will get to the overview of the web datastream, as the graphic above shows.
The advantage with this is that if you are not sure if you are working with the old version of GA (Universal Analytics) or with the new one (Google Analytics 4), first of all go to the Admin Interface → Property Settings:
If there is UA ID here, you are in an old UA account.
If there is no UA-ID here, you are in a new GA4 account.
NEW: BigQuery link🤩
In Google Analytics 4, Google now allows ALL Google users to export Google Analytics data to BigQuery (BQ) – completely free of charge.$$$$$
Quick Note: Exporting GA data to BQ used to be reserved for Google Analytics 360 (GA360) customers only, who paid a lot of money for it. I even know companies that switched to GA360 just because of the BigQuery interface….
The fact that Google now opens the BigQuery interface for all users shows how closely the Google tools work together and how well thought out and flexible GA4 is.
For your information, BigQuery is Google’s cloud data warehouse. You can store any data in it and query it in seconds using BigQuery enormous computing power.
In Google Analytics 4, your raw data is automatically stored in BigQuery and you can query it using SQL. This is revolutionary, because until now no other web analytics tool provided its raw data for free!
But to be able to work with BigQuery, you need to know how to code with SQL.
To access your raw data, you need to link Google Analytics 4 with BigQuery.
Goals vs conversion events
In Google Analytics 4, goals are defined differently than in Universal Analytics – and that’s a good thing, because the old goal settings were outdated.
As a reminder, in Universal Analytics, goals are created in the Admin Interface at the Data View level → Goals:
The setup was super complicated on the one hand and yet also kind of… limited.
So there were five different goal types (Destination, Duration, Pages/Screens per Session, Event and Smart Goal):
Combinations of URL and Event were not possible.
Funnels were only available for the Destination target type.
Worst of all, only 20 destinations could be defined per data view. This was far too few even for the smallest websites.
The disadvantage: You could not delete destinations once they were created.
In comparison, the new goals in Google Analytics 4 are super convenient, quick and easy to set up.
Goals are based – just like everything in GA4 – on events.
Events are recorded and listed in the “All Events” standard report:
This is where the goal definition now takes place.
Each event can be easily marked as a conversion via the toggle switch – no matter whether automatically captured events or user-defined events:
“Goals” are now called “Conversions” in Google Analytics 4. So if you have marked your events as goal or conversion, they will be logged specifically and you can view a detailed analysis in the conversion report:
Important: Just like in Universal Analytics, a conversion is always recorded once it is activated. Conversion data is NOT recorded retroactively.
If you want to have a funnel for a conversion – just like with destination goals in Universal Analytics – you can easily build your own funnel in the funnel analysis.
Another great update is that goals can be archived. This frees up slots if you reach the limit of 30 conversions per GA4 property.
Custom Dimensions vs Event Parameters
Custom Dimensions is a technical term from Universal Analytics
Way back in the day – back in Classic Analytics – there were Custom Variables. This legacy hides in the Universal Analytics interface to this day:
A variable (another word for placeholder) is known and can be easily assigned. A Custom Definition, on the other hand, cannot really be assigned at first.
On the other hand, a Custom Definition differs from a Custom Variable in the sense that there are two types:
- Custom Dimensions
- Custom Metrics
Note: That’s why nobody talks about Custom Definitions but about Custom Dimensions and Custom Metrics.
So custom dimensions in UA are custom event parameters in GA4. Custom Metrics in UA are also Custom Event parameters in GA4.
What happened to the session and product-based scopes you ask with panc? They don’t exist anymore! Instead, you simply use event parameters.
An event is a hit, and so the associated parameters are simply hits.
You can add up to 25 hit-based parameters to events in Google Analytics 4. However, there is a total limit of 50 text and 50 numeric parameters per GA4 property.
However, since the term “Custom Dimension” is so well established in the Google Analytics world, Google has followed suit for Google Analytics 4.
EXTREMELY IMPORTANT TO NOTE: By default, your Custom Event parameters will NOT show up in GA4. You CANNOT do any analytics with them – by default!
To use event parameters for analysis, you must REGISTER them first.
Your event parameters are registered via Custom Definitions.
I.e. With every event parameter, you want to analyze in detail in GA4 you have to register first under Configure -> Custom Definitions. Only then will the data collection of the parameter start and only then you can perform a detailed analysis.
Custom Dimensions can therefore be created directly in the reporting area under Configure -> Custom Definitions:
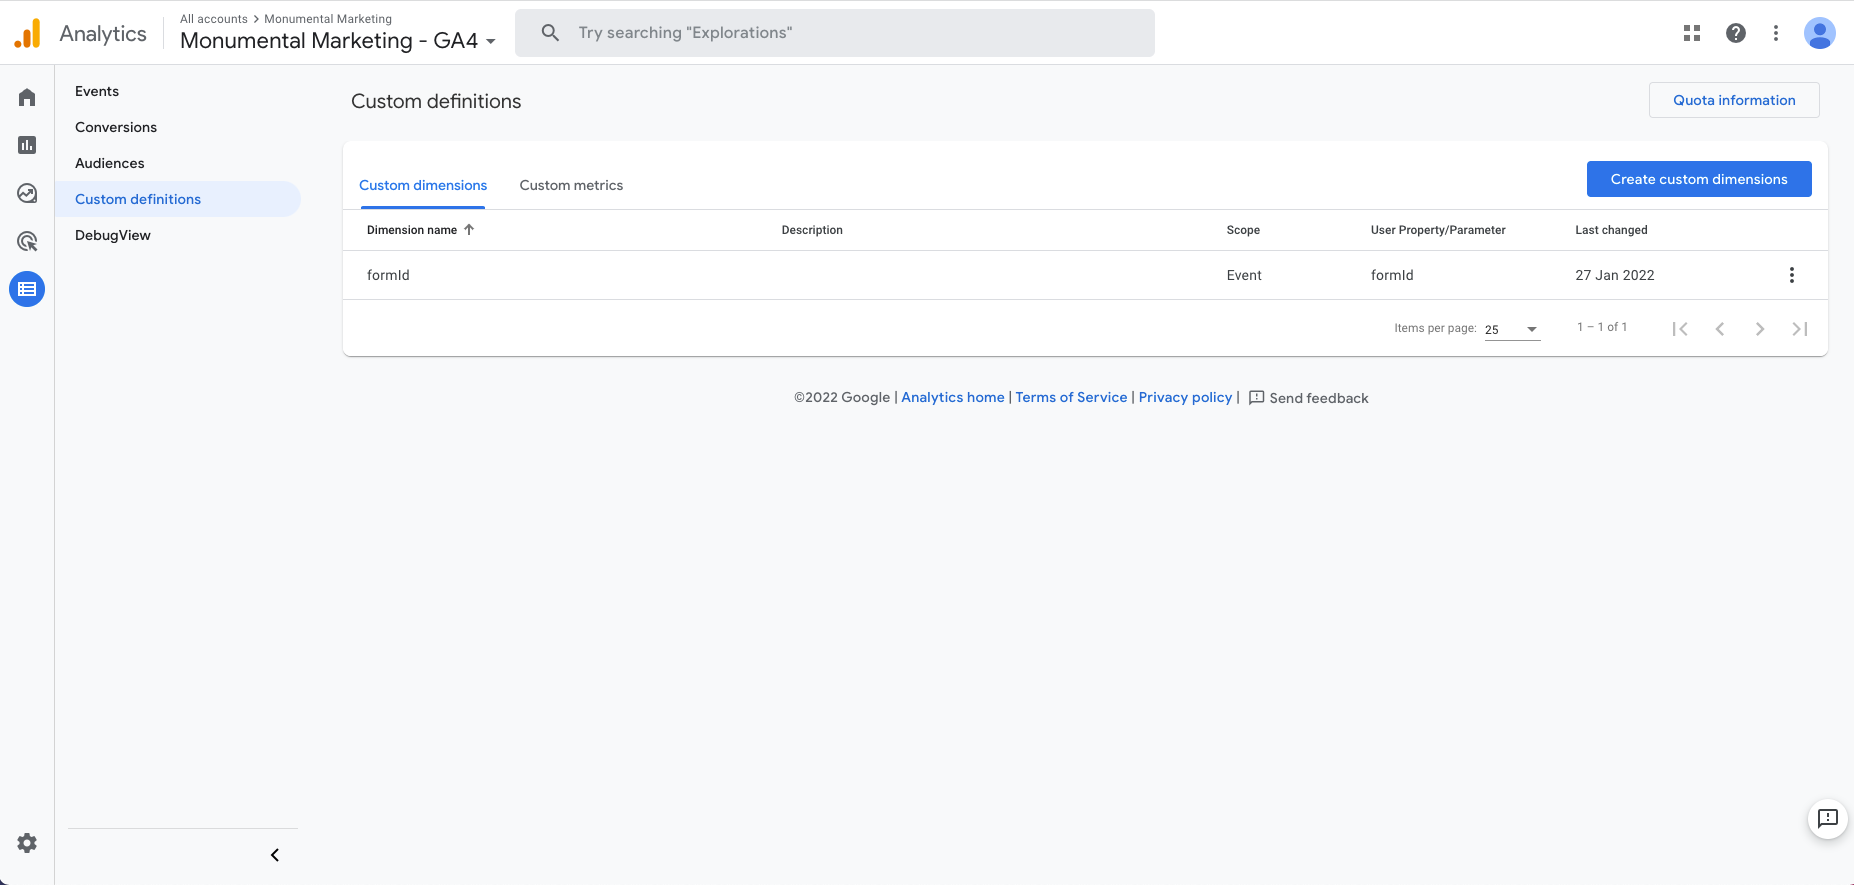
Here you can choose whether Custom Dimension or Custom Metric:
It is important to know that the basis of a Custom Dimension is again simply an Event Parameter.
This means that when you define the Custom Definition, all available Event Parameters are displayed and you select the one you want:
Newer than new: The reports
If anything has visibly changed in Google Analytics 4, it’s the user interface or the reporting area
The new user interface in Google Analytics 4 is definitely:
- More beautiful
- More modern
- Tidier
- More structured
Let’s take a look under the hood
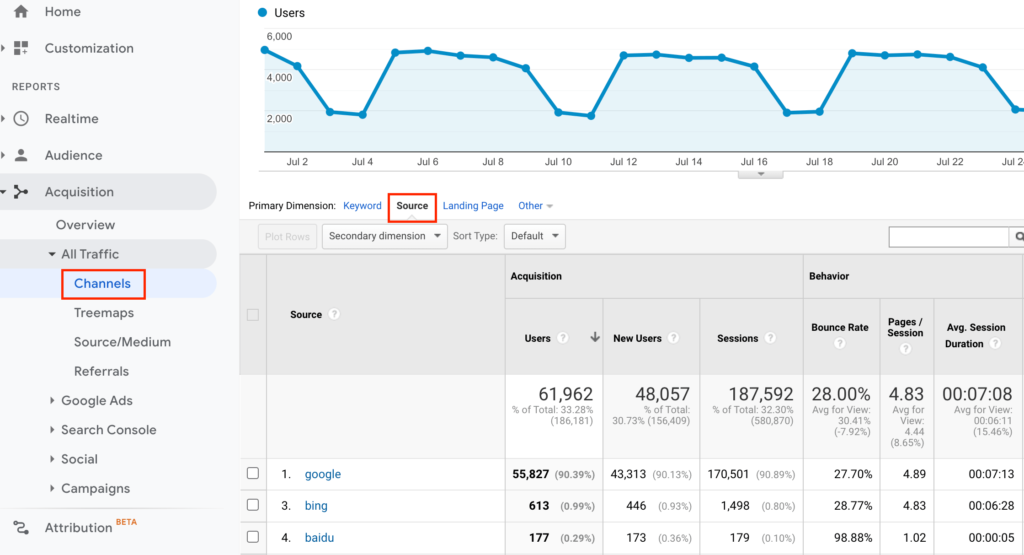
Report navigation: ABC vs. lifecycle
When you open Google Analytics 4 for the first time, you may be a bit surprised: The report navigation is completely new.
In Universal Analytics, there was the Real-Time and Audience report area. All other reports have been divided into the A-B-C sections:
- A is for Acquisition,
- B for Behavior, and
- C for Conversion
Google Analytics 4 breaks away from this pattern and introduces a new menu structure: The Customer Lifecycle.
This leads from customer acquisition, to engagement, to monetization, to actual customer retention.
This is exactly how the report navigation is structured in GA4:
In addition, there are separate user reports and an area for events as well as configurations.
The home page and real-time were taken from Universal Analytics and improved.
Behind each report area, there were about a million standard reports in Universal Analytics – the whole thing was getting quite confusing:
Google Analytics 4 has also countered this:
Important: In Google Analytics 4, many detail reports can ONLY be called up via the overview report and are NOT linked to the report menu.
So don’t worry if you can’t find a particular report in the report navigation – it’s probably hiding in the overview report.
ABC Reports vs Dashboard or Explorer Template
In Universal Analytics, the default reports are built-in tables and graphs. All very technical and hard to manage:
The tables always follow the following format: ABC. Again, A stands for Acquisition, B for Behavior and C for Conversions:
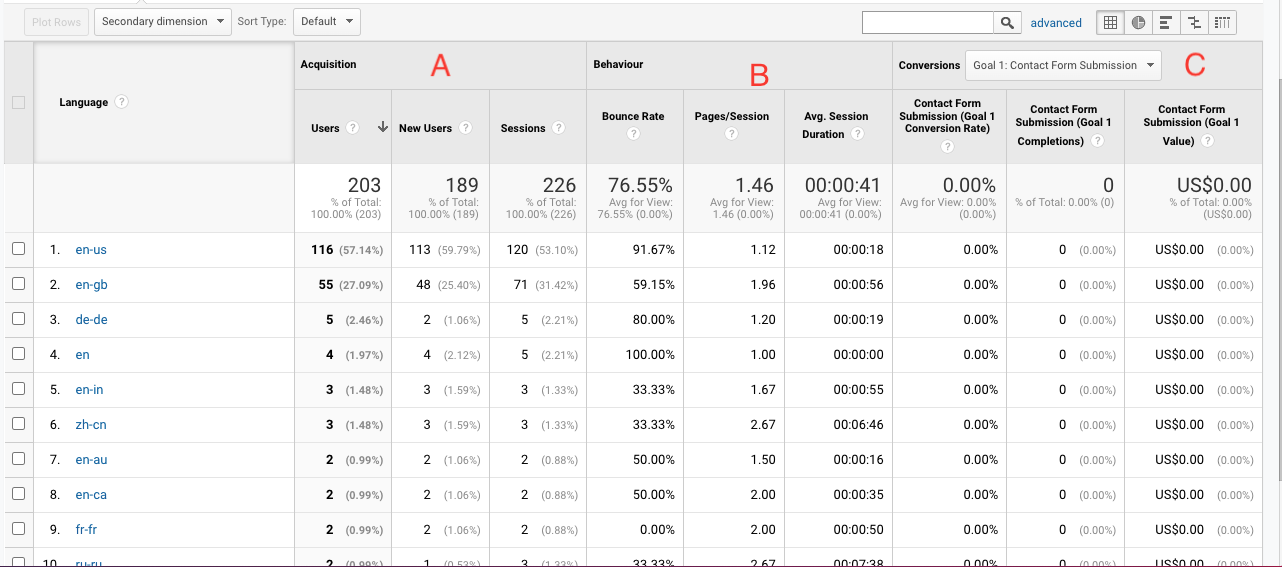
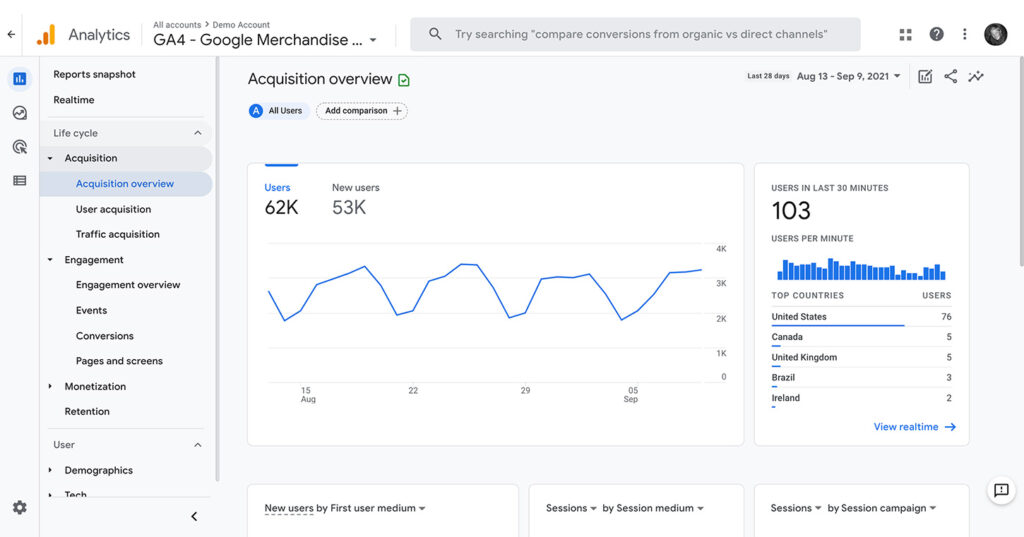
In Google Analytics 4, Google relies on two different report templates:
- The Dashboard template.
- The Explorer Template.
Each report sequence consists of stylish reporting cards – similar to Google Data Studio.
For the overview reports, the dashboard template is used:
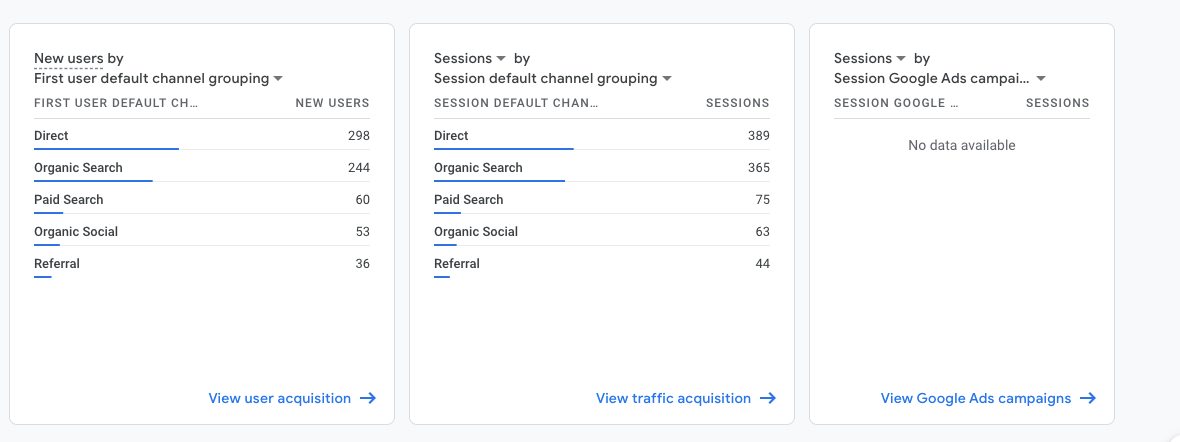
Each dashboard consists of multiple infographics, each focusing on a specific combination of dimensions and metrics.
For example:
- New users (metric) and user medium (dimension) in the last 30 days.
- Users (metric) by country (dimension) in the last 30 minutes.
Just like in Universal Analytics, the time period can be set on each info card itself.
Each dashboard always includes a real-time report as well.
Many graphs have a link to detailed reports with a wider selection of metrics and the ability to select different primary and secondary dimensions.
Important to note: In Google Analytics 4, many detail reports are ONLY accessible via the overview report and are NO longer found on the left side of the report menu.
For the detail reports the explorer template in GA4 is used:
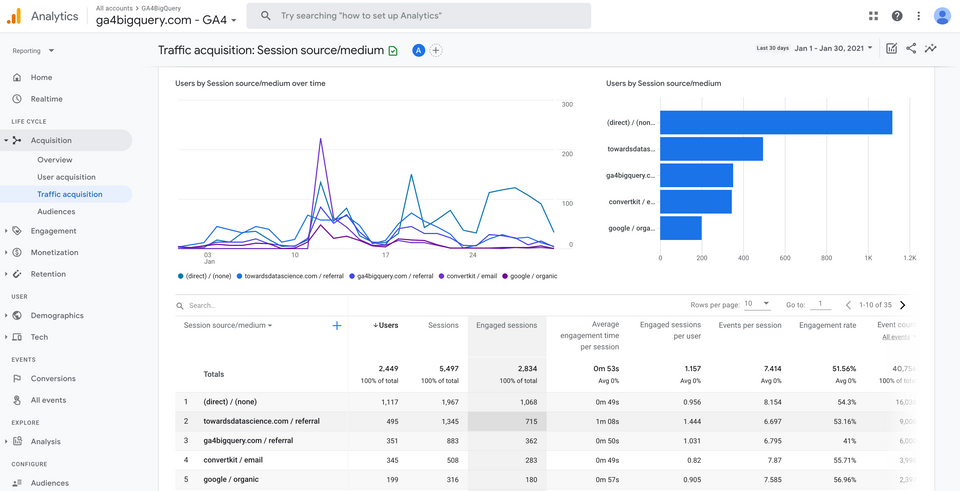
The detail reports in Google Analytics 4 always have the same structure: They consist of a line chart and a scatter plot.
Below that, the details are in a table, as you are used to from Universal Analytics.
The explorer template is interactive. Here, the data can be explored in more depth.
Custom Reports vs Advanced Analysis
In Universal Analytics, there is a “Customizations” section. Here you can create your own dashboards and custom reports:
Custom reports are super, super important in data analysis, because not every standard report shows exactly what you want to analyze. In a custom report, you can build your own analysis.
In addition, custom reports are saved automatically. You can filter your data as you like, segment it and call it up again at a later time.
Google has also recognized that custom reports are important and has expanded them in Google Analytics 4. You can also find them on the left in the report navigation, but under Explore → Analysis
Segments vs. Comparisons
There are super many ways to generate insights from data in Universal Analytics.
- Reporting filters
- Drill Downs
- Our beloved segments
In Google Analytics 4, on the other hand, there are only comparisons:
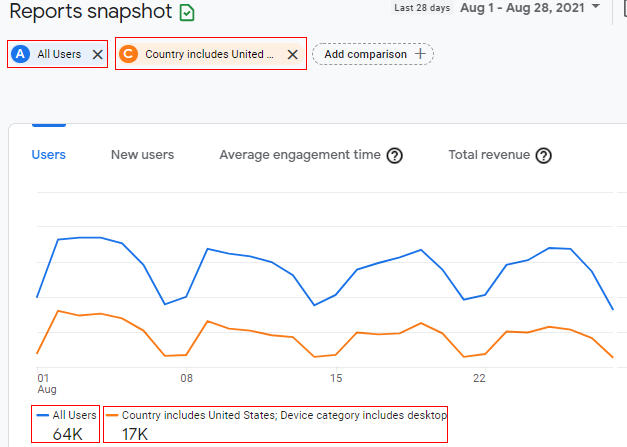
A comparison works SIMILAR to the segmentation in Universal Analytics: the comparison remains active until you remove it from the reports.
So you can apply it, jump through your reports and compare your data.
OTHER than that with Universal Analytics, your comparisons are NOT saved. If you want to use them again, you have to create them from scratch.
In a nutshell Unlike Universal Analytics, Google Analytics 4 no longer has report filters or traditional segments. Instead, only comparisons are made.
How fast data is updated
In Universal Analytics, data is processed and presented in reports after 24 hours
Note: In GA360 (i.e. the paid version of GA), data was guaranteed to be processed after 4 hours at the latest – but most of the time it was actually displayed in reports much faster.
In Google Analytics 4, the data timeliness is now also back to 24 hours (previously 72h).
NEW: App+Web analytics together
Probably the biggest and most groundbreaking analytics change in the new Google Analytics 4 is, the ability to analyze apps and websites together – actually in the same data pot.
This doesn’t sound particularly exciting at first, but it’s actually a long-awaited, highly desired, and also totally logical feature. After all, the app is often just another channel for a company – just like the website. So it’s only logical to analyze the data together as well.
What’s special about it? The app and web data fit together 1:1 because Google Analytics 4 unified the app and web tracking.
Conceptually, the data in the app is tracked exactly the same as on the website and thus recorded exactly the same in Google Analytics.
Only this enables the joint data analysis.
The basis for this is the common event-based data model, which has ALWAYS been the foundation for app tracking with Firebase Analytics – Google’s app tracking tool.
With Google Analytics 4, Google unifies its two tracking tools and technically relies on Firebase’s revolutionary event-based measurement model.
This will completely turn website tracking on its head and there is a lot of migration work to come. The big advantage, however, is the joint analytics opportunity this creates: App+Web data together in one data pot.
It’s important to think about both your app and website requirements from the start when making the switch.
It’s best to create a migration concept and check which events you have in the app and whether you also need them for the website.
Conversely, you should also check which events you have on the website and whether you also need them for the app.
Depending on the configuration, this also means that the data in the Google Analytics 4 Property and thus in ALL standard reports are both app and web-based. You must always take this into account when doing an analysis
If you want to analyze ONLY App or ONLY Web data, you have to create a segment first.
Important: If you don’t have an app and want to only analyze your website in Google Analytics 4 , then you can just analyse your website alone. ✅
UA vs GA4: A comparison of the metrics
In the old Universal Analytics, there are a whole bunch of metrics.
Some we used for our analytics.
Many we ignored.
Some were so complex that they filled hours of YouTube tutorials, and yet they were so important that there was no way around using them.
In Google Analytics 4, Google has cleaned up🧹: Instead of complex metrics, there are now fewer, more thoughtful metrics.
But this also means that we have to part with some metrics in GA4 and reconsider how we do our analyses.
Bounce rate vs. user engagement
Bounce rate has always been one of those things – a love-hate relationship.
As a reminder, the bounce rate measures the percentage of users who came to your website and left it IMMEDIATELY – without visiting even a second subpage.
On the one hand, we needed it to measure the engagement of website users.
On the other hand, however, it can be influenced via the Non-Interaction Event parameter. If you set the NI parameter to true, users are suddenly no longer recorded as bouncers. This makes sense for scroll tracking events, but was often used incorrectly in the past.
The bottom line? A manipulated bounce rate and therefore manipulated engagement.
Analytics? Pointless!
So the accuracy and meaningfulness of the bounce rate is often questionable. Not to mention the misinterpretation and wrong recommendations for action based on it.
Google has also understood this and has not even included the bounce rate in Google Analytics 4.
As a result the bounce rate was chucked out of Google Analytics 4!
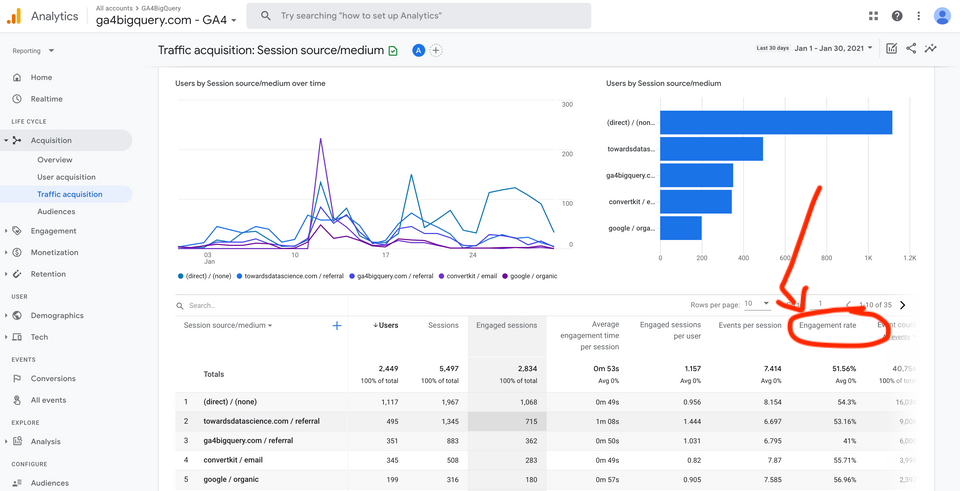
Instead, Google has introduced Engagement Rate: 🤩
The engagement rate is composed of the ratio of “engaged session” to the total number of sessions on the website.
The “engaged sessions” are the new key metric here, which is made up of several factors. Google defines these differently depending on the industry:
- Content Publisher: users who scroll slowly on the website and thus read.
- Ecommerce: Users who linger on the product detail page and thus read through the details to make a purchase decision.
- Online banking apps: Users who check account balances.
- University websites: Users watching an infographic video.
So in essence, you can say engaged sessions are users who stay on the website for more than 10 seconds, or have triggered a conversion event or had more than one pageview / screenview.
An added metric is that if a visitor is on a webpage but does not engage for a long period of time then he or she is considered as an “unengaged sessions” in Google Analytics 4.
Super cool huh?
This gives you a much better idea of whether your users actually found the content they were looking for and how engaged your users are with the website.
Where can you find the new engagement metrics? In the lifecycle reports, for example, under Acquisition → User Acquisition:
Don’t worry, even though the bounce rate hasn’t been adopted in Google Analytics 4, you can still determine it.
As I said, it’s a love-hate relationship and years of using the bounce rate have made us get used to it and “need” it in our reports.
In fact, the engagement rate is basically nothing more than the reverse bounce rate.
If the engagement rate is 40%, for example. What are the remaining 60%?
Correct… those who bounced
Important: You should not compare the reverse engagement rate from GA4 1:1 with the bounce rate from UA!
The data from both tools are collected differently and determined differently.
In addition, the engagement rate in GA4 is much more accurate than the bounce rate in UA. So if you have e.g. 60% bouncers in GA4 (because 40% engagement rate), the bounce rate in Universal Analytics is probably much higher.
This is because session is finally measured properly in Google Analytics 4:
Session vs. upgraded Session
Universal Analytics is session-focused: A session is like a container to which all further interactions of the user are assigned and this is as long as the user is active on the website.
After 30 minutes of inactivity, the session is automatically closed. If the user continues surfing after 35 minutes, a new session is automatically started.
The session is also automatically closed at midnight, because a new day starts and a session cannot run across days.
A new session also starts when you come to your website through another campaign (UTM parameters).
All this may be absolutely familiar to you, but in UA it led to incredibly complex errors and weird numbers in the reports:
That’s why you have more users than sessions in your UA reports.
In Google Analytics 4, sessions are finally measured correctly 🙌.
A session in GA4 starts when the website is opened and ends when the website is left. WOW! 😅
A new campaign does NOT result in a new session, instead the campaign feeds into the Customer Journey. ✅
A day change (midnight) also does NOT result in a new session, instead, it simply continues until the user leaves the website. ✅
The only thing left from the old session from UA: The new session in GA4 also ends automatically after 30 minutes of inactivity.
However, there is no limit to how long a session can last. ✅
Speaking of session duration, lets talk about session duration.
Session Duration vs. Engagement Time
Session duration is a nagging issue in Universal Analytics because it’s never really been calculated properly.
In a nutshell: The problem is that session duration is calculated from the first hit and the last hit. Often, only page views are used for calculation because no other events are recorded. However, since no hit is usually fired on the last page, the time spent on the last page is NOT included in the calculation of session duration. If you spend 10 seconds on the first three pages and 15 minutes on the last page, Google Analytics will still only show 10 seconds because the dwell time on the last page cannot be recorded.
But dwell time is a very strong engagement signal. It is simply incredibly important.
Google has also recognized this and fixed the session duration problem in Google Analytics 4: 🙌
So the session (session_start) in Google Analytics 4 starts as soon as the website is opened and ends as soon as the website is left. ✅
Since every interaction (including the page view) in GA4 are ONLY events, the calculation is easy: it is done from the first to the last event in the session.
Since a scroll event is usually sent again automatically at the end of a session, the calculation is much more accurate. ✅
🛑✋Be careful when comparing data
With all the comparisons, it may seem obvious to also compare the data between Universal Analytics and Google Analytics 4.
You can do that. It’s also super interesting.
Nevertheless, I rather advise against it, because even if you have a flawless set up and track absolutely the same in GA4 as in UA, your data will probably not match.
Important: No matter if Universal Analytics, Google Analytics 4, Webtrekk, Adobe Analytics and how all the other web analytics tools are called – different tools ALWAYS collect data in different ways.
Each tool uses its own measurement and processing methods and because of the many differences I’ve already mentioned, you’ll notice how different Universal Analytics is compared to Google Analytics 4.
Even if you have 80% more / less traffic in GA4, it doesn’t automatically mean you have a tracking error. Your conversions should be the same in both tools.
Tip: If you want to do a data comparison to check your Google Analytics 4 tracking for accuracy, I recommend using the brand new DebugView in GA4 instead.
Otherwise, I recommend understanding Google Analytics 4 as a completely new tool. That is, similar to how you got into Universal Analytics, you can now get into Google Analytics 4.
Specifically, this means:
- Understanding the data model.
- Getting to know the dimensions and metrics.
- Identifying the reports that are relevant to you.
Just like when you started with Universal Analytics.
The advantage: You automatically get out of the UA mindset.
Universal Analytics is old and will disappear from the scene in the next two to five years. So it makes no sense to hold on to it.
In addition, the switch from Universal Analytics to Google Analytics 4 is similar to a tool switch because EVERYTHING IS DIFFERENT.
But not everything.
A few things (very, very few!) have even remained the same:
What has remained the same with UA and GA4?
Not much has remained the same if you compare Universal Analytics with Google Analytics 4. In fact, you’ll probably find more parallels between GA4 and Firebase, Google’s app tracking tool, because Firebase served as the basis for creating GA4.
Nevertheless: a few things have remained the same and this should not be forgotten in a fully comprehensive tool comparison.
Therefore here are the details:
Audience
An audience is an audience and will always remain an audience – in Universal Analytics as well as in Google Analytics 4.
Audiences are used as target groups for campaigns.
They are created based on the data collected in Analytics and can then be used in the Google advertising tools (Ads, Display, etc) for remarketing campaigns. However, for this to happen, the tools need to be linked together.
While audiences in Universal Analytics are created at Property level → Product Linking → Audiences:
Audiences can do much more in GA4 than in UA – I would call them extended audiences or audiences+.
But more about that another time…
Attribution: LNDC vs. Last Click (cross-channel)
Also exciting is the attribution model that is used in all standard reports.
In Universal Analytics this is called: Last non-direct Click.
This means that the last click gets the conversion – unless the last click is direct, then the second to last.
In Google Analytics 4, the default attribution model is called Last Click (across channels).
And although the attribution model in UA and GA4 have two different names, both models actually work pretty much the same.
Because even in GA4, the last click gets the conversion – unless the last click is direct, in which case it’s the second to last.
Generally, in all attribution models in GA4, direct visits are not assigned a conversion unless there is no other way.
What is different, however, is the default attribution window: in UA this is 6 months, and the time limit is adjustable. In GA4, the default attribution window is 30 days. Currently the time limit in GA4 is not adjustable!
All details about the new attribution model in GA4 can be found in the Google Doc: >> Last Click (cross-channel)
ClientID
The ClientID has also remained the same in Google Analytics 4 compared to Universal Analytics: it is a unique, randomly generated string that acts as a pseudo-anonymized identifier and anonymously identifies a browser instance.
The ClientID is stored in the browser cookies so that subsequent calls to the same website can be assigned to the same user.
This is the case in UA and is also the case in GA4.
UserID
The UserID is also the same in Google Analytics 4 compared to Universal Analytics: It is a unique, non-personal number assigned to a single user.
This allows the user to be recognized across platforms (web, app) and devices (desktop, mobile, tablet) and gives you much more accurate data in your reports.
In order to use the UserID function, you must be able to uniquely identify your users, e.g. via a login. This is the same in Universal Analytics as in Google Analytics 4.
The only difference: If the user was recognized in Universal Analytics, he was recognized retroactively for the whole session. UA has done backward stitching here. Automatic.
In Google Analytics 4 there is NO backward stitching anymore!
If the UserID in GA4 is sent to GA e.g. via the login event – it will ONLY be sent via this event and NOT retroactively for the whole session. So you have to take care of the storage mechansism yourself!
Second but positive difference: unlike Universal Analytics, a Google Analytics 4 property natively embeds the User ID in ALL reports, analytics and stats.
A separate User ID report data view is no longer required in GA4.
UTM parameters
UTM parameters also remain with us in Google Analytics 4 – even though they are an Urchin legacy and were introduced in 2003 (!).
UTM parameters have not only consolidated in Google Analytics but are also used in many other systems for tracking source and medium.
Info: UTM means Urchin Tracking Module.